Radio ad analytics
Live todayYour market moved this morning. Your report is from last quarter.
Budgets shift, campaigns launch, and advertisers change course every day — and every one of those moves is a sales opening for the team that sees it first. Spotwise turns live broadcast data into a continuously updated view of your radio market: who is on air, how often, on which stations, and what their estimated spend looks like — modelled from panel data and rate cards, with the method shown next to the number. No month-old reports. No guessing.
What it is
Market intelligence that is never out of date.
Real-time radio ad analytics is the continuous measurement of advertising activity across your monitored stations — live, structured, and current the moment you open it.
Traditional radio market intelligence is periodic by design: industry reports compiled on a schedule, panel summaries delivered weeks after the measurement period, competitive analysis done by hand. By the time the data reaches your team, the market it describes is gone.
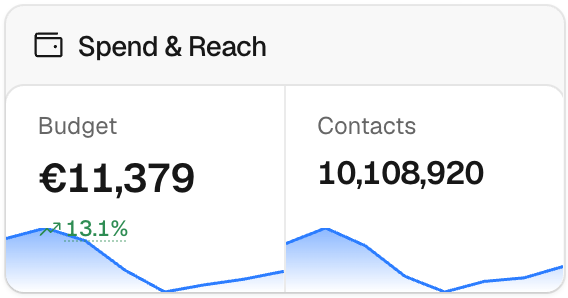
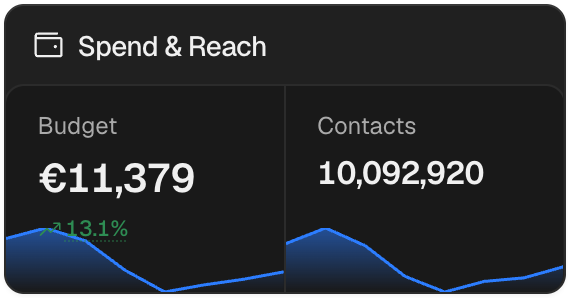
Spotwise works from the broadcast itself. Every ad detected across your monitored stations feeds a live analytics layer — advertiser activity, frequency, share of voice, category mix, and estimated spend modelled from panel data and rate cards. Your dashboard is not a snapshot of the market. It is the market, as it stands right now.
- Continuous ingestion
Spotwise monitors your configured stations around the clock, capturing every ad event and passing it to the analytics engine as it airs — not on a reporting schedule.
- Live metrics & trends
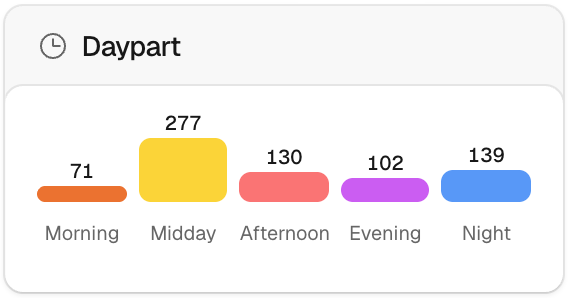
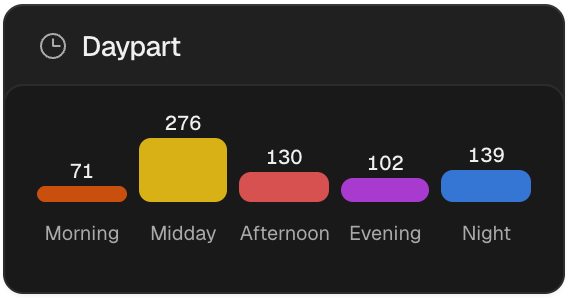
Each detected event updates the live metric set: advertiser activity, frequency rates, station share of voice, category breakdowns, and estimated spend — always modelled from panel data and rate cards, never presented as billed figures. Trend lines recalculate as new data arrives.
- Anomaly & opportunity flags
New entrants, sudden frequency spikes, seasonal deviations, and station-level volume shifts are flagged automatically — surfaced in your dashboard and wired to configurable alerts.
- Explore & export
Filter by station, advertiser, category, or date range. Export structured data sets for strategy sessions, management reporting, or your wider BI stack.
Capabilities
Numbers your sellers can stand behind.
Dashboards are easy. Defensible ones are not. Every Spotwise metric carries its method — so your team can quote it in a pitch without flinching.
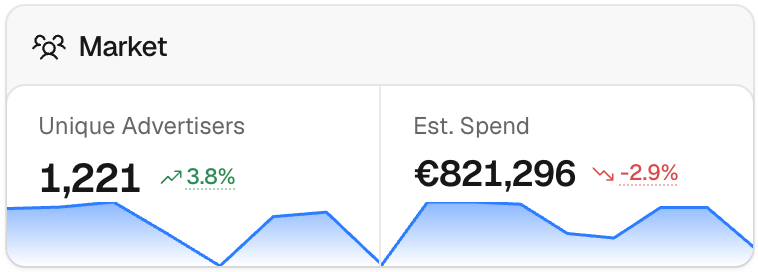
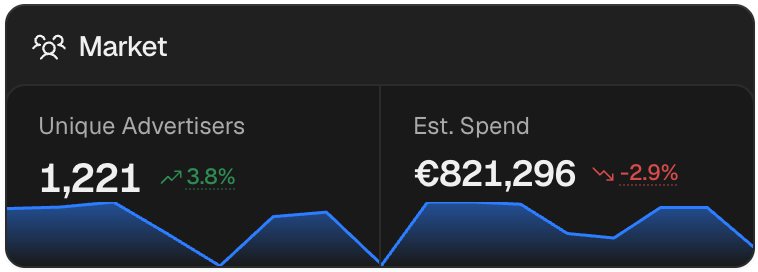
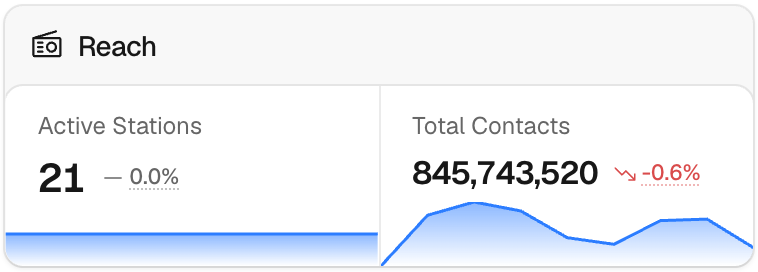
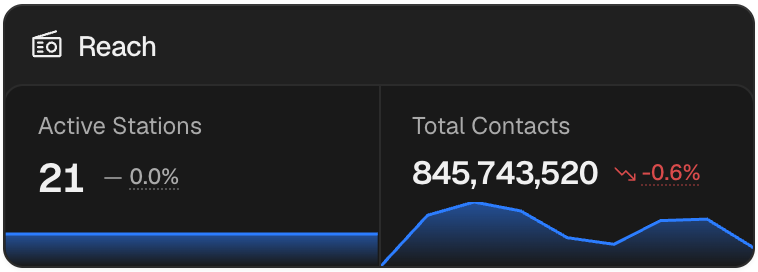
- Live market dashboard
- A real-time view of advertising activity across every monitored station: active advertisers, ad frequency, category distribution, and estimated spend modelled from panel data and rate cards — refreshed as each new ad is detected.
- Advertiser trend tracking
- Any advertiser as a time series — rising, falling, or stable trajectories, creative rotation, station loyalty. Time your outreach to the moment their strategy is moving, not after it has settled.
- Share & category intelligence
- Which categories dominate your market, which are underrepresented on your stations, and how the mix shifts over time. Concrete material for choosing the verticals your team goes after next.
- Custom reporting & export
- Build views for any combination of stations, advertisers, dates, and metrics. Export structured reports for board decks, strategy planning, or integration with your business intelligence tools.
Who it serves
For everyone who decides with data.
Commercial directors & revenue leaders
Set targets, watch competitor-station activity, and make pricing, inventory, and category calls from live market data — not from a report describing a quarter that already ended.
Sales teams & business development
Prioritise outreach by what advertisers are doing right now. Walk into every meeting with a live view of the prospect’s category — who is on air, how often, and where the estimated budgets are moving.
Research & strategy teams
Produce market reports from continuously fresh data, track category trends over any monitored period, and build the competitive picture that shapes your station’s long-term positioning.
Why it matters
Stale data costs deals. Live data wins them.
Decide on the market as it is
Your team knows which categories are hot now, which advertisers are actively spending, and where the market is heading — a systematic edge over competitors selling off last quarter’s picture.
Catch openings as they form
A brand ramping up its radio activity never announces it. The signal is in the broadcast data — if you are watching. Live analytics means your team sees the move while there is still time to act on it.
Strategy built on evidence
Rate cards, inventory, targets, and category focus — set from live market data with the modelling method visible, instead of instinct and anecdote.
Sell as an intelligence partner
When your sellers can tell a prospect what is happening in their category right now — which competitors are on air, what the estimated spend levels look like, what creative is rotating — your station stops being an inventory seller and becomes a market authority.
See it live
Your market, measured in real time.
Book a demo and we will open the analytics dashboard on your stations, your competitors, your categories.
Common questions
What teams ask about radio ad analytics.
Related solutions
The market will not wait for the next report
Stop reading the past. Watch the market move.
Somewhere in your market, a budget shifted today — and the team that sees it first wins the conversation. See what live analytics shows on your stations, your categories, your numbers.